fall 2016
Mentor: Dr. Jimmy Fox
Partner: Atena Amirsoleimani
A Sediment Budget Analysis: Louisville Yacht Club Marina, Ky
Abstract
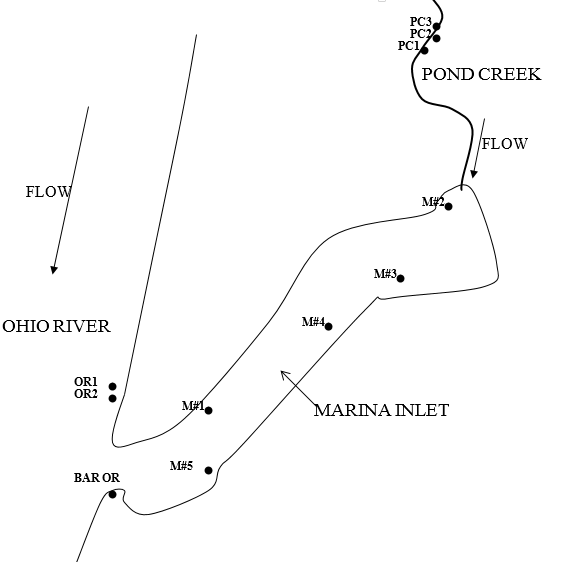
Figure 1: Schematic of sample locations.
In this report, a sediment budget analysis is being performed for the Louisville Yacht Club Marina in Louisville, Kentucky. Using a number of tracers contained within sediment at the Yacht Club location, we will be preforming an analysis to determine from which sources sediment is being eroded and ultimately deposited at the location of interest. We have identified the Ohio River and Pond Creek as sources in this analysis. Using samples form the Yacht Club and these two sources, we aim to determine through statistical means (t-testing) which tracers we can best help us identify the proportions of sediment from each source that are contributing to the total. Iron, Potassium, Nickle, and Zinc were identified as tracers that could be used in a simple unmixing model to ultimately identify the proportions of sediment being contributed to the deposition at the Yacht Club. This process concluded that roughly 30% of that sediment was contributed from the Ohio River, and roughly 70% was being contributed by Pond Creek. Leading to the conclusion of Pond Creek being the dominant source of sediment load production, using that we calculate the sediment yield for the marina.
Introduction
Increased sedimentation in small reservoirs can be detrimental to the local environment and benthic habitat for many organisms. Deposition of fine sediments can have severe ramifications on an ecosystem’s trophic level by blocking the accessibility of oxygen for macrophytes. Fine sediments within a water column can also reduce the amount of light penetration, inhibiting photosynthetic processes. An increase in sediment delivery to a local accommodation space may eventually increase flood potential due to the raised stream bed while reducing the water capacity.
The Louisville Yacht Club and Marina is impacted by sedimentation processes originating from the transport and deposition of fine sediments from the Ohio River and the conjoined Pond Creek tributary, a source of sediment originating from nearby construction sites (Figure 1). The Marina is located on the southern bank of river mile marker 593 of the Ohio River. It has been observed that during storm events, sediment is deposited within the marina, often requiring dredging remediation to maintain the function of the marina. The immediate stakeholders of high sedimentation impacting the Marina include the boat owners and the associated consultants who prescribe the dredging and remediation maintenance measures. By calculating the sediment budget for the marina and determining the sediment yield ratio for the sources, we can devise a plan of operation to control erosional processes provided by the dominant source.
Argument
Identifying sediment sources and the extent erosional processes can transport sediments in fluvial settings is essential for watershed management. Construction sites are notorious for being the source of large volumes of sediment that ultimately get deposited in local watersheds. Due to the surficial and invasive nature of construction processes, construction sites characteristically involve exposed soil due to the removal of topsoil and vegetative layer, loose soil from excavation operations, and possess no trees to provide this soil with canopy cover. The culmination of these factors lead to a severely elevated susceptibility to erosion by rainfall impact. According to Zech et al. (2009), more than 80 million tons of sediment are washed from construction sites in the U.S. each year. This process can bring on a number of issues such as reducing reservoir capacities downstream or negatively impacting the habitat and environment of organisms within the stream. Challenges posed by erosion from construction sites are approached by applying best management practices to the impacted sites (Zech et al, 2009).
Beighley et al. (2010) investigated the application of erosion control blankets which typically formed with compost. Overlying the exposed soil with compost blankets is a suggested approach to provide resistance against the erosive forces of runoff on the site. This study concluded that the blankets were effective in reducing erosion from runoff by increasing flow resistance and providing more time for the runoff to infiltrate the soil.
Figure 2: Scatterplots for elemental data relative to mixed Marina sediment compositions.
The Universal Soil Loss Equation, as discussed in Clark et al. (2009), is used as a predictive tool to be applied to construction sites. The variable outlined with the most value was Rainfall Erosivity (R) due to the relationship that it is independent of land use practices for these sites. The paper considers a study performed in Pennsylvania where researchers collected R values at various locations and compared their values with the ones provided by the USDA isoerodent maps. Their results revealed that the USLE underestimates the impact of rainfall for erosion estimates. Constructing sediment ponds and utilizing erosion control blankets were suggested to be the best methods for reducing the impacts of eroded sediments.
Adverse effects on aquatic biota, reduction of freshwater habitats, and decreasing microbial population are consequences of increased sedimentation (Zhang et al., 2012). Endemic to the Ohio River is the orange-footed pearly mussel, an organism that utilizes filter feeding at the sediment-water interface of the streambed. The mussel population is now endangered due to upstream construction activities and transport of fine sediments. Non-point source sediment delivery to sensitive aquatic ecosystems for grains less than 62 μm in diameter is considered to be the most prevalent pollutant in the U.S. (Davis et al., 2009).
Zinger and et al. (2011) studied extreme sediment pulses in the Wabash River in the Midwest. They discovered that each major stream discharge event triggered a rapid delivery of sediment from one to five orders of magnitude greater than those produced by lateral migration of individual bends. Much of the material produced by these events was deposited at the confluence of the Wabash and Ohio River. This study of meander cutoffs can be related to our study in the Ohio River where ultimately the sedimentation of the marina is caused by high discharge events that result in backflow as the raised Ohio River feeds back into the marina with slower flow velocity.
The impact of erosion processes that occur from upstream construction site operations increase with greater surface area of bare soil on these sites. Various design elements and BMP’s can be applied to properly planned areas from our sediment source project to significantly reduce the amount of sediment being transported to streams including silt fences, sediment ponds, and erosion control blankets.
Methods & Results
Table 1: Client provided data.
Sediment data was collected including inorganic elements and sediment bed deposition measurements. Inorganic elemental tracer data was collected at the source locations and mixture locations. In addition, depth of deposited sediment was collected at the mixture locations. The depth of deposition occurred over a 30 month period. Using the elemental data provided (Table 1) by the client, we were able to deduce the appropriate sediment tracers that differentiate the two sources of sediment impacting the Marina. The 12 tracers included Al, Ba, Ca, Co, Cr, Cu, Fe, K, Mn, Ni, Sr, and Zn. By creating scatterplots of the elemental data we can visually limit which tracers may be suited. From this selection, we performed T-tests to verify the tracers are statistically different.
Table 2: T-test.
From the scatterplots, we were able to surmise that Ni, K, Fe, and Zn are viable tracers to differentiate the sediment sources (Figure 2). To verify this interpretation, we performed T-tests. All 4 tracers proved viable because the T-values were more than the 2.5 value presented in the t-table (Table 2).
A simple un-mixing model was used to determine the relative sediment source contributions. With each tracer for the two sources, 5 mixing locations were considered to apply the model (Equation 1, Equation 2). The procedure was repeated several times and the average mass fraction was calculated.
T(mix) = X1T1 + X2T2 Equation (1)
X1 + X2 =1 Equation (2)
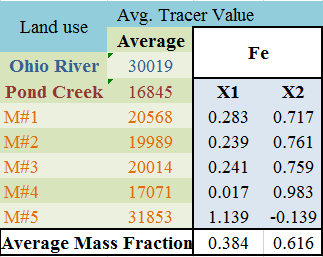
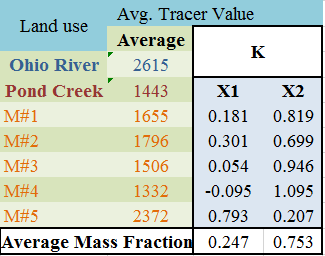
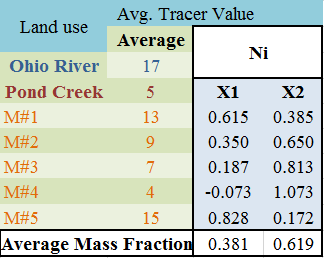
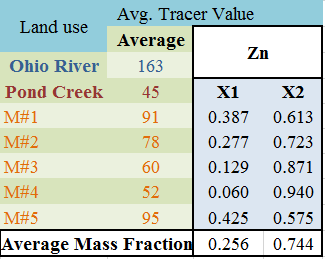
The following tables represent all results for the 4 tracers: Fe, K, Ni, Zn.
Tracer: Fe
As shown in Figure 3, X1 and X2 are equal to 0.384 and 0.616, respectively. Pond Creek contributes 61.1% and Ohio River provides 38.4 % for the iron content.
Tracer: K
As shown in Figure 4, X1 and X2 are equal to 0.247 and 0.753, respectively. Pond Creek provides 75.3 % and Ohio River contributes 24.7% load of the total potassium content for the sediments.
Tracer: Ni
As shown in Figure 5, X1 and X2 are equal to 0.381 and 0.619, respectively. Pond Creek supplies 61.9 % and Ohio River adds 38.1% load of the total nickel content for the sediments.
Tracer: Zn
As shown in Figure 6, X1 and X2 are equal to 0.256 and 0.744, respectively. Pond Creek provides 74.4 % and Ohio River supplies 25.6% load of the total zinc content for the sediments.
The next step would include a sediment yield calculation. To estimate our sediment budget, we implemented the Reservoir Method for calculating sediment yield for the 30 month duration of deposition. In order to perform a sediment budget for a watershed, we must estimate the mean total streambed storage by considering the approximate surface area, depth of sediment sampling, and fine sediment bulk density.
The area of the Marina’s water surface was calculated by creating a polygon using ArcGIS software. We found 31844.54181 m^2 to be the approximate area. According to the client. the time interval for deposition was 30 months. The mass of sediment in and out of the system will be derived from using the range of bulk density for sediment and an average volume given by measurements of sediment bed deposits. Bulk density of the sediment is assumed to be between 1.1 and 1.4.
The mass of sediment stored in the bed, mB, is estimated using the following equation: Equation (4).
Where VB is the volume of sediment in the bed equal to the surface area of the deposition zone (31844.54181 m^2) times its average depth and pB is the sediment bulk density in the streambed. The average depth of sediment deposition was found to be 64.4 cm.
Using these equations we found that between approximately 751.95578 meters^3 and 957.0346 meters^3 are being transported and deposited to the system on average per month.
Discussion
Assumptions considered in our analysis include assuming large scale variability was adequately accounted for in sampling of sediments at different locations within the watershed. The depth of stored sediment in the Marina deposits varies, indicating the dependence of sediment storage zones on the small-scale variation and control of geomorphologic features in the corridor. We assumed the control of these features were uniform throughout the basin. For our sediment yield equation, we are assuming conservation of mass applies within our reservoir and that there is no reworking of sediment out of the reservoir after it has first been delivered during this one month time interval.
The results reflected the literature well. Our dominant source contributing the most sediment was consistently the Pond Creek tributary due to its proximity to the construction site upstream and its episodic, flushing nature represented by the local hydrograph. The Ohio River contribution of sediment had a steadier, tidal effect on the marina. Most of the sediment entering the marina from the Ohio River most likely occurred when the Ohio River was at or near bankfull level.
This study could be very useful for other consultants that frequently must carry out dredging remediation operations in small watersheds. The best use for a client’s budget could go towards constructing sediment ponds and implementing silt fences and erosion blankets upstream near the construction site to dramatically reduce the sediment delivered to a storage area.
References
1. Zech W.C, McDonald J.S., Clement T.P. (2009)” Field Evaluation of silt fence tieback systems at a highway construction site”. Practice periodical on structural design and construction, ASCE. 14(3): 105-112.
2. Beighley R.E, Sholl B., Facette L.B, and Governo J. (2010).” Runoff characteristics for construction site erosion control practices”. J. Irrigation and drainage engineering, ASCE. June 2010: 405-413.
3. Clark S.E, Allison A.A, Stiler R.A. (2009).” Geographic variability of rainfall erosivity estimation and impact on construction site erosion control design”. J. Irrigation and drainage engineering, ASCE. July/Augest 2009:474-479.
4. Zhang Y. S, Collins A.L, Horowitz A.J. (2012). “A preliminary assessment of the spatial sources of contemporary suspended sediment in the Ohio River basin”. J.Hydrological processes, 26, pp: 326-334.
5. USGS Report “Results of a Two-Dimensional Hydrodynamic and Sediment-Transport Model to Predict the Effects of the Phased Construction and Operation of the Olmsted Locks and Dam on the Ohio River near Olmsted, Illinois”. Water- resources investigation report 03-4336, Department of the Interior, Geological Survey.
6. Davis C. M, M.ASCE, Fox J. F and M.ASCE. (2009). “Sediment fingerprinting: Review of the method and future improvement for allocation nonpoint source pollution”.135, pp: 490-504.
7. Belmont P, Gran K, Schottler S.P, Wilcock P, Day S. D, Jennings C, Lauer J. W, Viparelli E, Willenbring J. K, Engstrom D. R, Parker G. 2011. “Large Shift in Source of Fine Sediment in the Upper Mississippi River”. J. Environ. Sci. Technol. (45), pp: 8804-8810.
8. Collins, A. L., & Walling, D. E. (2002). Selecting fingerprint properties for discriminating potential suspended sediment sources in river basins. Journal of hydrology, 261(1), pp: 218-244.
9. Horowitz, A. J., Elrick, K. A., & Smith, J. J. (2001). Estimating suspended sediment and trace element fluxes in large river basins: methodological considerations as applied to the NASQAN programme. Hydrological Processes, 15(7), pp: 1107-1132.
10. Zinger, J. A., Rhoads, B. L., & Best, J. L. (2011). Extreme sediment pulses generated by bend cutoffs along a large meandering river. Nature Geoscience, 4(10), 675-678.
